
2021 Recap: A Year to Remember
January 18, 2022
With 2021 in the books, let’s revisit the five bold predictions for active ETFs that the New York Stock Exchange made at the beginning of the year:
- Assets under management (AUM): Grow from $172.8 billion at the start of the year to exceed $300 billion by year-end 2021.
- Full-year cash flow: Leapfrog 2020’s record of $60 billion and rise to over $70 billion.
- Mutual fund to ETF conversions: 5+ issuers convert, totaling over $40 billion in AUM.
- Active semi-transparent: 25 ETFs will launch and assets will exceed $2.5 billion.
- Growth milestone: At least 1 issuer will eclipse $50 billion in AUM.
How did these predictions end up?
- Assets ended the year at $293.1 billion, just shy of our $300 billion prediction and up 70% year-over-year.
- Full-year cash flow far exceeded our prediction, ending the year at $90.1 billion. That’s $30 billion more than 2020’s record and 3.25 times more than 2018.
- Five separate issuers launched 14 new active ETFs via conversion from legacy mutual funds with the NYSE. In addition to two launched elsewhere, combined assets were $42.0 billion, another win for our predictions.
- 24 new active semi-transparent ETFs came to market during 2021, narrowly missing our prediction. Meanwhile assets far exceeded our expectations, growing to $5.6 billion, up nearly 5x from the end of 2020.
- Newcomer DFA further solidified its entry into the market, ending the year as the asset leader with $45.2 billion and narrowly beating First Trust ($44.9 billion). Moral of the story-no $50 billion club this year.
Two for five with a few narrow misses is a tough pill to swallow. All told, though, 2021 was a year of remarkable growth and expansion for the active ETF market.
Beyond our bold predictions, here are a few additional stats that stood out to us:
- Number of years the Active ETF market exceeded 10% of total industry cash flow: 2 years (2020 & 2021). In fact, during 2021, active ETFs accounted for 10% of total industry CF despite being only 4% of total assets.
- % of cash flow going to active ETFs priced over the active market average of 0.49%: 60%. These ETFs accumulated $54.2 billion in cash flow, surpassing their market share of 47% of assets.
- Firms with postive cash flow: 136 firms, or all but 10 firms.
- Active ETFs with postive cash flow: 624 active ETFs, or nearly 85% off all ETFs.
- Active ETFs launched: 294 active ETFs launched and $61.0 billion in new assets.
- Most commonly launched ETFs by category: Domestic equity ETFs, 140 launched and $41.8 billion in new assets.
The Growth of Active ETFs
Source: Factset as of 12/31/2021
Despite back-to-back quarter quarters with a year-over-year drop in quarterly cash flow, the industry finished 2021 with $90.1 billion in new flows and exceeded 2020’s record by $30 billion. All asset classes grew during the year with equity flows of $46.1 billion leading the way. Notably, domestic oriented strategies surpassed their global counterparts for the first time in two years and notched a record year. This was likely a result of the continued outperformance of the US equity market as well as a pullback in the ARK growth story we chronicled throughout 2020. Region-agnostic, thematic ETFs (i.e., Innovation, Cannabis, Fintech Revolution, Future Health, etc.) led the way in equity supported by income, inflation, and core equity focused style ETFs as well as ESG strategies. Fixed income flows of $30.7 billion favored global mandates with continued interest in senior loan portfolios, municipals as well as ultra and short-term ETFs. Commodities at $10.1 billon experienced a record year, led by broad commodity portfolios, new carbon strategies and the industry’s first bitcoin linked futures ETFs.
Active ETF Fund Flows by Asset Class
| Int'l/Global Equity | Domestic Equity | Domestic Fixed Income | Int'l/Global Fixed Income | Commodities | Asset Allocation | Alternatives | Currency | |
| AUM Leader | DFA | ARK | First Trust | JPMorgan | Invesco | ETC | First Trust | WisdomTree |
| AUM Leader $B | $34.2 | $30.5 | $20.6 | $23.8 | $4.3 | $2.5 | $0.7 | $0.05 |
| 2021 CF Leader | JPMorgam | ARL | State Street | JPMorgan | BlackRock | ETC | Simplify | Van Eck |
| 2021 CF $B | $5.5 | $8.2 | $6.5 | $5.7 | $2.7 | $01.1 | $0.2 | $0.01 |
| Q4 CF Leader | Nuveen | DFA | First Trust | BlackRock | ProShares | WisdomTree | First Trust | Va Eck |
| Q4 CF Leader $B | $3.3 | $1.1 | $1.3 | $0.9 | $1.6 | $0.4 | $0.1 | $0.01 |
Source: Factset as of 12/31/2021
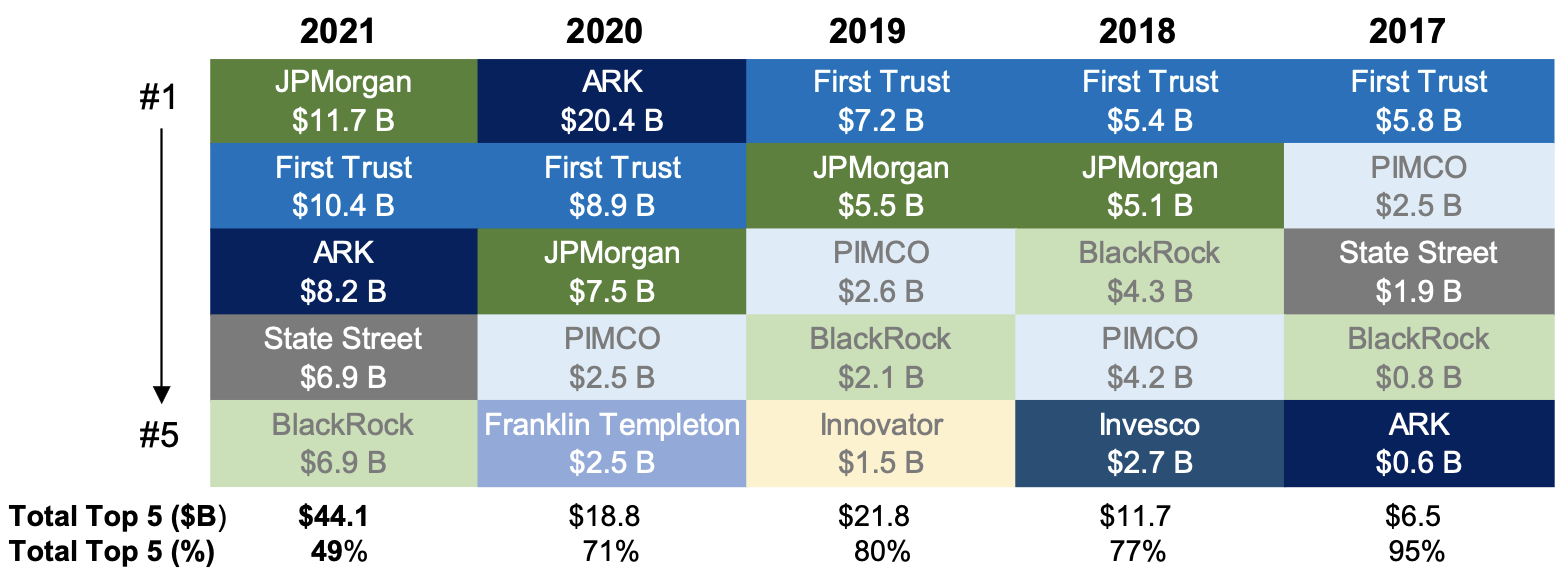
At the issuer level, ARK officially ceded the cash-flow crown and fell to the third spot. JPMorgan, which led third-quarter inflows with $3.7 billion and had year-to-date flows totaling $11.7 billion became the 2021 cash-flow king. Its success was driven by a combination of ongoing growth in the domestic fixed income business ($6.0 billion) and newfound strength in an equities business ($5.8 billion) that welcomed five new ETFs in 2021. Rounding out the top five were First Trust ($10.4 billion), ARK ($8.2 billion), State Street ($6.9 billion) and BlackRock ($6.9 billion). Narrowly missing the top 5 were asset leader and mutual fund to ETF conversion pioneer DFA ($5.8 billion) and core product producer American Century ($5.0 billion). Collectively, the top five issuers accounted for 49% of cash flow — 19% lower than at the end of 2020.
Top 5 Issuers by Cash Flow Annually (2017- 2021)
Source: Factset as of 12/31/2021
Across the industry during 2021, all except 10 issuers experienced neutral or positive cash flows, with 55 seeing inflows exceed $100 million and 18 surpassing $1 billion. Nuveen ($3.3 billion), Invesco ($2.8 billion), Amplify ($2.0 billion), AdvisorShares ($1.7 billion), Quadratic ($1.7 billion), ProShares ($1.6 billion) KraneShares ($1.4 billion), Fidelity ($1.3 billion), ETC ($1.3 billion), Innovator ($1.3 billion) and Roundhill (1.0 billion) all surpassed the $1 billion cash-flow mark. A few other notable year-over-year growers include, Simplify ($837 million, 10x 2020 flows), Horizon Kinetics ($810 million, 2021 entrant), Nationwide ($760 million, 6x 2020 flows), Vanguard ($510 million, 13x 2020 flows) and Main Management ($325 million, 63x 2020 flows).
At the product level, 85% of active ETFs experienced positive flows for the year and nearly 65% experienced positive cash flows during the fourth quarter. Through the year, 198 ETFs exceeded $50 million in cash flow (often viewed as a break-even measure for an ETF), representing 26% of all active ETFs. Additionally, unlike the broader ETF industry, those ETFs priced at the lowest range aren’t dominating flows. In 2021, ETFs priced at or above the active ETF market average of 0.49 bps secured 60% of the flows.
| Expense Ratio | 12/31 AUM | 2021 CF | % AUM | % CF | # ETFs |
|---|---|---|---|---|---|
| 0-25 bps | $87,374,075,026 | $18,831,971,244 | 30% | 21% | 77 |
| 26-50 bps | $72,558,881,206 | $19,246,885,694 | 25% | 21% | 157 |
| 51-75 bps | $80,676,145,666 | $31,770,775,651 | 28% | 35% | 199 |
| 76 bps + | $52,446,588,657 | $20,149,229,781 | 18% | 22% | 315 |
The 2021 product level cash-flow crown goes to State Street’s SPDR Blackstone Senior Loan ETF ($6.8 billion). The fourth-quarter crown goes to Nuveen’s Growth Opportunities ETF ($3.3 billion). It also became the industry’s first, and only, ETF to date leveraging a novel structure that shields alpha generation (NYSE Active Proxy Structure) to surpass $1 billion in cash flows.
| Ticker | Top 10 ETFs by Cash Flow ($B) | YTD 2021 ($M) |
|---|---|---|
| SRLN | SPDR Blackstone Senior Loan ETF | $6,756 |
| JEPI | JPMorgan Equity Premium Income ETF | $5,443 |
| ARKK | ARK Innovation ETF | $4,767 |
| NUGO | Nuveen Growth Opportunities ETF | $3,275 |
| JPST | JPMorgan Ultra-Short Income ETF | $2,982 |
| COMT | iShares U.S. ETF Trust iShares GSCI Commodity Dynamic Roll Strategy ETF | $2,392 |
| PDBC | Invesco Optimum Yield Diversified Commodity Strategy No K-1 ETF | $2,144 |
| FPE | First Trust Preferred Securities & Income ETF | $2,102 |
| FTSL | First Trust Senior Loan Fund | $1,800 |
| IVOL | Quadratic Interest Rate Volatility & Inflation Hedge ETF | $1,656 |
| Ticker | Top 10 ETFs by Cash Flow ($B) | Q4 2021 ($M) |
|---|---|---|
| NUGO | Nuveen Growth Opportunities ETF | $3,263 |
| JEPI | JPMorgan Equity Premium Income ETF | $1,822 |
| BITO | ProShares Bitcoin Strategy ETF | $1,613 |
| SRLN | SPDR Blackstone Senior Loan ETF | $1,369 |
| META | Roundhill Ball Metaverse ETF | $871 |
| AVUV | Avantis U.S. Small Cap Value ETF | $589 |
| DFSD | Dimensional Short-Duration Fixed Income ETF | $577 |
| MSOS | AdvisorShares Pure US Cannabis ETF | $513 |
| DFAC | Dimensional U.S. Core Equity 2 ETF | $492 |
| FPE | First Trust Preferred Securities & Income ETF | $488 |
| Ticker | Bottom 10 ETFs by Cash Flow | YTD 2021 ($M) |
|---|---|---|
| FTSM | First Trust Enhanced Short Maturity ETF | $(858) |
| MINT | PIMCO Enhanced Short Maturity Active ETF | $(576) |
| VNLA | Janus Henderson Short Duration Income ETF | $(292) |
| TOTL | SPDR DoubleLine Total Return Tactical ETF | $(267) |
| DFEB | FT Cboe Vest U.S. Equity Deep Buffer ETF - February | $(229) |
| AWTM | Aware Ultra-Short Duration Enhanced Income ETF | $(180) |
| GSY | Invesco Ultra Short Duration ETF | $(156) |
| LBMS | First Trust Low Duration Opportunities ETF | $(150) |
| FTSD | Franklin Liberty Short Duration U.S. Government ETF | $(133) |
| ULTR | IQ Ultra Short Duration ETF | $(96) |
| Ticker | Bottom 10 ETFs by Cash Flow | Q3 2021 ($M) |
|---|---|---|
| ARKG | ARK Genomic Revolution ETF | $(920) |
| IVOL | Quadratic Interest Rate Volatility & Inflation Hedge ETF | $(836) |
| MINT | PIMCO Enhanced Short Maturity Active ETF | $(676) |
| ARKK | ARK Innovation ETF | $(663) |
| ARKW | ARK Next Generation Internet ETF | $(573) |
| ARKF | ARK Fintech Innovation ETF | $(525) |
| LMBS | First Trust Low Duration Opportunities ETF | $(442) |
| ARKQ | ARK Autonomous Technology & Robotics ETF | $(335) |
| CLSM | Cabana Target Leading Sector Moderate ETF | $(193) |
| VNLA | Janus Henderson Short Duration Income ETF | $(139) |
As the active market enters its 15th year, its prospects are quite bright. Asset managers continue to recognize the benefits of the ETF wrapper and have more entry choices than ever. With the mutual to ETF conversions path paved during a historic 2021 and an increased choice of multiple structures that shield their alpha generation techniques, albeit in limited asset scope, we will be watching how the industry approaches evolving distribution dynamics, continued product proliferation and increased investor adoption.
Bold predictions for 2022
- AUM: Grow from $293.1 billion to exceed $425 billion by year-end 2022.
- Full-year cash flow: Another new record with over $80 billion.
- Mutual fund to ETF conversions: 10+ issuers will complete Mutual Fund to ETF conversations totaling over $20 billion.
- Active semi-transparent: 20+ ETFs will launch and assets will exceed $10 billion.
- Growth milestone: At least 1 issuer will eclipse $60 billion in AUM.
Launch Monitor - Full Year 2021 & Q4
Full year launch monitor
Q4 LAUNCH MONITOR
Active ETF Stat Pack
| Firms | |||
|---|---|---|---|
| # of Issuers | 162 | ||
| # of New Issuers 2021 | 69 | ||
| Products | Assets | ||
| # of ETFs | 749 | AUM ($B) | $292.99 |
| # of New Launches 2021 | 292 | 3 Yr AUM CAGR | 163% |
| Avg. ER | 0.49% | 5 Yr AUM CAGR | 60% |
| Cash Flow | Trading | ||
| YTD Cash Flow ($B) | $90.00 | YTD ADV (Shares) | 72,928,455 |
| 3 Yr Cash Flow | $176.50 | YTD ADV ($) | $3.91 B |
| 5 Yr Cash Flow | $218.70 | YTD Avg. Spread (bps)* | 29.64 |
Source: Factset & NYSE Internal Database and Consolidated Tape Statistics as of 12/31/2021
*Simple average
Active, Semi-Transparent Update
| Ticker | Inception | Name | AUM | YTD Flows | 30 Day Median Spread (bps) | ADV (shares) | Structure | LMM | Expense Ratio | Listing |
|---|---|---|---|---|---|---|---|---|---|---|
| EQOP | 9/17/20 | Natixis U.S. Equity Opportunities ETF | $10,380,871 | $(3,887,723) | 16.38 | 1,284 | NYSE AMS | Citadel | 0.90% | NYSE |
| VNSE | 9/17/20 | Natixis Vaughan Nelson Select ETF | $6,431,577 | $(835,373) | 15.87 | 1,339 | NYSE AMS | Citadel | 0.80% | NYSE |
| VNMC | 9/17/20 | Natixis Vaughan Nelson Mid Cap ETF | $8,891,969 | $184,519 | 16.41 | 2,053 | NYSE AMS | Citadel | 0.85% | NYSE |
| ESGA | 7/15/20 | American Century Sustainable Equity ETF | $166,221,000 | $20,515,643 | 14.46 | 9,205 | NYSE AMS | Citadel | 0.39% | NYSE |
| MID | 7/15/20 | American Century Mid Cap Growth Impact ETF | $26,330,906 | $17,260,397 | 15.47 | 2,609 | NYSE AMS | Citadel | 0.45% | NYSE |
| ESGY | 7/1/21 | American Century Sustainable Growth ETF | $7,416,912 | $1,359,211 | 8.79 | 1,361 | NYSE AMS | Citadel | 0.39% | NYSE |
| NDVG | 8/5/21 | Nuveen Dividend Growth ETF | $6,636,000 | $1,022,818 | 7.6 | 2,704 | NYSE AMS | Citadel | 0.64% | NYSE |
| NSCS | 8/5/21 | Nuveen Small Cap Select ETF | $6,785,402 | $1,555,988 | 11.83 | 3,010 | NYSE AMS | Citadel | 0.85% | NYSE |
| NWLG | 8/5/21 | Nuveen Winslow Large-Cap Growth ESG ETF | $6,386,400 | $1,039,594 | 7.64 | 2,537 | NYSE AMS | Citadel | 0.64% | NYSE |
| NUGO | 9/28/21 | Nuveen Growth Opportunities ETF | $3,338,188,470 | $3,274,891,998 | 7.65 | 1,952,398 | NYSE AMS | Citadel | 0.55% | NYSE |
| SAEF | 11/16/21 | Schwab Ariel ESG ETF | $8,204,150 | $8,213,176 | 23.19 | 14,464 | NYSE AMS | Flow Traders | 0.59% | NYSE |
| FDG | 4/2/20 | American Century Focused Dynamic Growth ETF | $212,042,051 | $(27,667,231) | 15.01 | 24,366 | ActiveShares | Citadel | 0.45% | Cboe BZX |
| FLV | 4/2/20 | American Century Focused Large Cap Value ETF | $237,374,132 | $42,729,027 | 14.42 | 11,016 | ActiveShares | Citadel | 0.42% | Cboe BZX |
| CFCV | 5/28/20 | ClearBridge Focus Value ETF | $3,711,883 | $(15,766) | 35.5 | 412 | ActiveShares | GTS | 0.50% | Cboe BZX |
| FBCG | 6/4/20 | Fidelity Blue Chip Growth ETF | $514,336,958 | $255,448,088 | 18.92 | 158,354 | Fidelity Proxy | GTS | 0.59% | Cboe BZX |
| FBCV | 6/4/20 | Fidelity Blue Chip Value ETF | $104,570,220 | $47,932,978 | 18.77 | 38,873 | Fidelity Proxy | GTS | 0.59% | Cboe BZX |
| FMIL | 6/4/20 | Fidelity New Millennium ETF | $62,241,690 | $32,757,233 | 21.32 | 23,656 | Fidelity Proxy | GTS | 0.59% | Cboe BZX |
| FGRO | 2/4/21 | Fidelity Growth Opportunities ETF | $58,456,440 | $55,921,990 | 5.11 | 42,452 | Fidelity Proxy | Citadel | 0.59% | Cboe BZX |
| FMAG | 2/4/21 | Fidelity Magellan ETF | $56,436,903 | $46,555,450 | 12.23 | 30,355 | Fidelity Proxy | RBC | 0.59% | Cboe BZX |
| FPRO | 2/4/21 | Fidelity Real Estate Investment ETF | $23,270,280 | $17,214,440 | 7.26 | 11,417 | Fidelity Proxy | Citadel | 0.59% | Cboe BZX |
| FSMO | 2/4/21 | Fidelity Small/Mid-Cap Opportunities ETF | $32,283,625 | $27,251,878 | 13.87 | 16,425 | Fidelity Proxy | RBC | 0.59% | Cboe BZX |
| FSST | 6/17/21 | Fidelity Sustainability U.S. Equity ETF | $6,154,693 | $3,764,645 | 11.97 | 5,566 | Fidelity Proxy | RBC | 0.59% | NYSE |
| FDWM | 6/17/21 | Fidelity Women's Leadership ETF | $3,149,985 | $1,025,135 | 13.62 | 1,573 | Fidelity Proxy | RBC | 0.59% | NYSE |
| TCHP | 8/5/20 | T. Rowe Price Blue Chip Growth ETF | $272,984,526 | $182,982,939 | 10.95 | 54,204 | T Rowe Proxy | Virtu | 0.57% | NYSE |
| TDVG | 8/5/20 | T. Rowe Price Dividend Growth ETF | $126,786,989 | $72,934,856 | 8.42 | 16,574 | T Rowe Proxy | RBC | 0.50% | NYSE |
| TEQI | 8/5/20 | T. Rowe Price Equity Income ETF | $57,776,680 | $27,755,603 | 10.93 | 8,663 | T Rowe Proxy | Virtu | 0.54% | NYSE |
| TGRW | 8/5/20 | T. Rowe Price Growth Stock ETF | $50,357,330 | $18,814,316 | 10.12 | 6,304 | T Rowe Proxy | RBC | 0.52% | NYSE |
| TSPA | 6/8/21 | T. Rowe Price U.S. Equity Research ETF | $23,234,682 | $5,849,741 | 9.81 | 2,545 | T Rowe Proxy | RBC | 0.52% | NYSE |
| IVDG | 12/22/20 | Invesco Focused Discovery Growth ETF | $1,246,154 | $(170,980) | 14.64 | 1,959 | Invesco Model | Citadel | 0.59% | Cboe BZX |
| IVSG | 12/22/20 | Invesco Select Growth ETF | $1,397,214 | $21,010 | 14.61 | 1,740 | Invesco Model | Citadel | 0.48% | Cboe BZX |
| IVLC | 12/22/20 | Invesco US Large Cap Core ESG ETF | $7,168,455 | $5,032,200 | 13.25 | 3,118 | Fidelity Proxy | Citadel | 0.48% | Cboe BZX |
| IVRA | 12/22/20 | Invesco Real Assets ESG ETF | $2,405,935 | $877,110 | 36.26 | 2,122 | Fidelity Proxy | Citadel | 0.59% | Cboe BZX |
| LOPP | 2/1/21 | Gabelli Love Our Planet & People ETF | $11,325,930 | $6,976,500 | 41.51 | 1,727 | ActiveShares | GTS | 0.90% | NYSE |
| GGRW | 2/16/21 | Gabelli Growth Innovators ETF | $4,135,090 | $1,302,865 | 21.55 | 498 | ActiveShares | GTS | 0.90% | NYSE |
| FRTY | 3/1/21 | Alger Mid Cap 40 ETF | $38,750,000 | $35,126,500 | 40.39 | 21,154 | ActiveShares | Virtu | 0.60% | NYSE |
| ATFV | 5/4/21 | Alger 35 ETF | $13,581,250 | $12,845,000 | 38.47 | 6,115 | ActiveShares | Virtu | 0.55% | NYSE |
| REIT | 2/26/21 | ALPS Active REIT ETF | $26,883,062 | $22,977,400 | 17.63 | 7,388 | Blue Tractor | GTS | 0.68% | NASDAQ |
| STNC | 3/16/21 | Stance Equity ESG Large Cap Core ETF | $39,638,832 | $6,379,829 | 25.23 | 2,297 | Blue Tractor | GTS | 0.85% | NYSE |
| PFUT | 5/26/21 | Putnam Sustainable Future ETF | $8,897,093 | $2,025,922 | 33.17 | 2,589 | Fidelity Proxy | Virtu | 0.64% | NYSE |
| PLDR | 5/26/21 | Putnam Sustainable Leaders ETF | $7,650,921 | $679,200 | 10.77 | 1,985 | Fidelity Proxy | RBC | 0.59% | NYSE |
| PGRO | 5/26/21 | Putnam Focused Large Cap Growth ETF | $10,285,438 | $700,098 | 10.31 | 4,382 | Fidelity Proxy | RBC | 0.55% | NYSE |
| PVAL | 5/26/21 | Putnam Focused Large Cap Value ETF | $18,910,994 | $10,093,318 | 29.04 | 5,827 | Fidelity Proxy | Virtu | 0.55% | NYSE |
| HFGO | 11/9/21 | Hartford Large Cap Growth ETF | $23,467,644 | $25,000,000 | 21.751 | 60,098 | Fidelity Proxy | Citadel | 0.59% | Cboe BZX |
| Total/Average | $5,629,319,091 | $4,237,441,540 | 17.39 | 2,508,623 | 0.60% |
Source: Factset & NYSE Internal Database and Consolidated Tape Statistics as of 9/24/2021
*Simple average
December Active ETF Launches
| Ticker | Name | Issuer | Launch Date | Asset Class | AUM |
|---|---|---|---|---|---|
| INNO | Harbor Disruptive Innovation ETF | Harbor | 12/2/21 | Equity | $5,442,498 |
| YUMY | VanEck Future of Food ETF | VanEck | 12/2/21 | Equity | $2,469,230 |
| AILV | Alpha Intelligent - Large Cap Value ETF | Mt Yale | 12/2/21 | Equity | $534,432 |
| AILG | Alpha Intelligent - Large Cap Growth ETF | Mt Yale | 12/2/21 | Equity | $765,831 |
| WLTG | WealthTrust DBS Long Term Growth ETF | WealthTrust Asset Management LLC | 12/7/21 | Asset Allocation | $1,295,040 |
| PTRB | PGIM Total Return Bond ETF | Prudential | 12/8/21 | Fixed Income | $24,907,850 |
| BKCI | BNY Mellon Concentrated International ETF | The Bank of New York Mellon Corp. | 12/8/21 | Equity | $10,355,652 |
| DEIF | Sterling Capital Diverse Multi-Manager Active ETF | Truist | 12/14/21 | Equity | $102,200,000 |
| TEMP | JPMorgan Climate Change Solutions ETF | JPMorgan Chase | 12/14/21 | Equity | $25,021,500 |
| JHPI | John Hancock Preferred Income ETF | Manulife | 12/15/21 | Fixed Income | $15,164,160 |
| BKES | BNY Mellon Sustainable Global Emerging Markets ETF | The Bank of New York Mellon Corp. | 12/15/21 | Equity | $9,950,050 |
| BKIS | BNY Mellon Sustainable International Equity ETF | The Bank of New York Mellon Corp. | 12/15/21 | Equity | $10,221,451 |
| BKUS | BNY Mellon Sustainable US Equity ETF | The Bank of New York Mellon Corp. | 12/15/21 | Equity | $10,237,651 |
| RAYD | Rayliant Quantitative Developed Market Equity ETF | Rayliant Investment Research | 12/16/21 | Equity | $2,542,014 |
| RAYE | Rayliant Quantamental Emerging Market Equity ETF | Rayliant Investment Research | 12/16/21 | Equity | $2,534,338 |
| BTHM | BlackRock Future U.S. Themes ETF | Blackrock | 12/16/21 | Equity | $5,099,860 |
| UBCB | UBC Algorithmic Fundamentals ETF | Ultra Blue | 12/16/21 | Equity | $1,260,235 |
| GRZZ | Grizzle Growth ETF | Grizzle | 12/17/21 | Equity | $758,565 |
| NTKI | Nationwide Russell 2000 Risk-Managed Income ETF | Nationwide | 12/17/21 | Equity | $17,640,770 |
| FCSH | Federated Hermes Short Duration Corporate ETF | Federated Hermes, Inc. | 12/17/21 | Fixed Income | $25,040,100 |
| VBB | Valkyrie Balance Sheet Opportunities ETF | Valkyrie Funds LLC | 12/15/21 | Equity | $617,860 |
| ZGEN | Generation Z ETF | EMPIRICAL FINANCE LLC | 12/16/21 | Equity | $5,247,438 |
| GFGF | Guru Favorite Stocks ETF | Alpha Architect | 12/16/21 | Equity | $21,344,904 |
| TMFG | Motley Fool Global Opportunities ETF | The Motley Fool | 12/13/21 | Equity | $643,566,580 |
| TMFM | Motley Fool Mid-Cap Growth ETF | The Motley Fool | 12/13/21 | Equity | $305,728,247 |
| FPAG | FPA Global Equity ETF | First Pacific Advisors LP | 12/17/21 | Equity | $1,279,000 |
| KDRN | Kingsbarn Tactical Bond ETF | Kingsbarn | 12/21/21 | Fixed Income | $1,878,405 |
| XDEC | FT Cboe Vest U.S. Equity Enhance & Moderate Buffer ETF - December | First Trust | 12/20/21 | Equity | $4,621,712 |
| CVAR | Cultivar ETF | Cultivar Capital, Inc. | 12/23/21 | Equity | $9,510,488 |
| ICAP | InfraCap Equity Income Fund ETF | InfraCap | 12/29/21 | Equity | $3,793,038 |
| EATV | VegTech Plant-based Innovation & Climate ETF | VegTech LLC | 12/29/21 | Equity | $2,256,507 |
| PPI | AXS Astoria Inflation Sensitive ETF | SR Partners LLC | 12/30/21 | Alternatives | $1,247,945 |
| Total - 32 New ETFs | $1,274,533,350 |
Source: Factset as of 12/31/2021
NYSE Active ETF Issuer Insights
Missed our Active ETF Webinar series or latest podcast series? Visit the redesigned HomeofETFs.com to catch up.
Hear from ETF experts including active ETF structure providers, fund sponsors (American Century, Alger, Fidelity, PIMCO and T. Rowe Price), liquidity providers (Flow Traders and Jane Street), and service providers (BBH, BNY Mellon and State Street).