
Data Insights
US Equity Market Activity:
Concentrated Volume and Auction Opportunity
February 9, 2021
Retail trading has dominated market discussion the last two weeks, capping off a run of dramatic growth which began last spring. Market volume set an all-time high on Wednesday, January 27th, which was then nearly broken the next day, while web searches for “Depository Trust & Clearing Corporation” exploded.
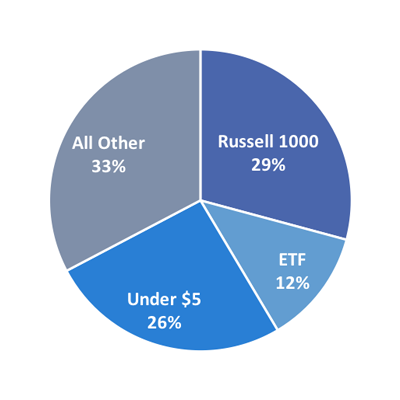
To see the varied impact of recent activity on different stocks, below we split the market into 4 distinct tracts: Russell 1000, ETFs, stocks under $5, and all other stocks1.
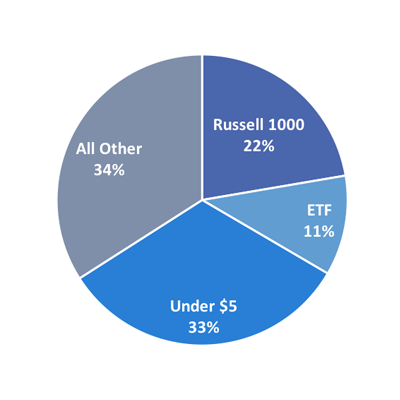
Market Share Volume Traded
December 2020
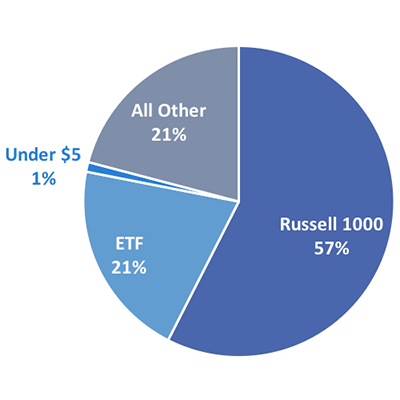
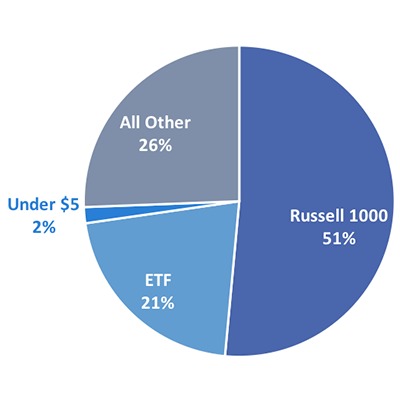
Market Dollar Value Traded
December 2020
Market Share Volume Traded
Jan 25 - Feb 5
Market Dollar Value Traded
Jan 25 - Feb 5
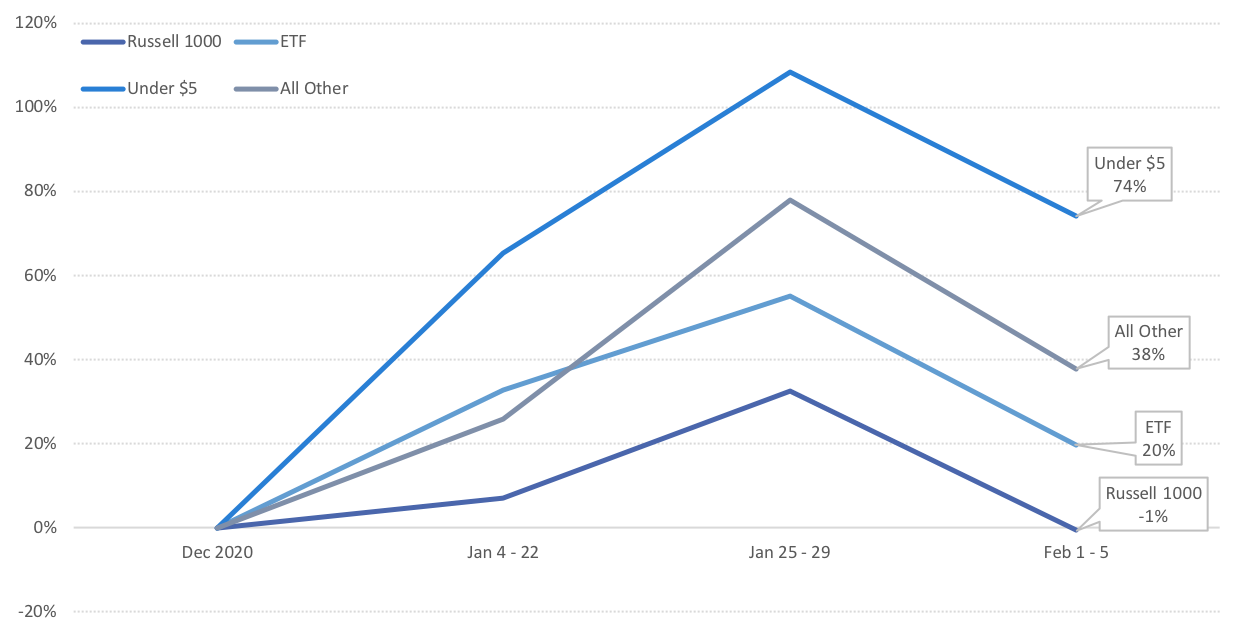
Recent market activity has been heavily skewed towards stocks under $5, and those in our “All Other” category. Last week, February 1st through February 5th, trading activity in the most widely-held securities, ETFs and the Russell 1000, quickly returned to previous levels while some volatility measures, such as quote volatility, in these same stocks remained elevated.
Volume Change vs December
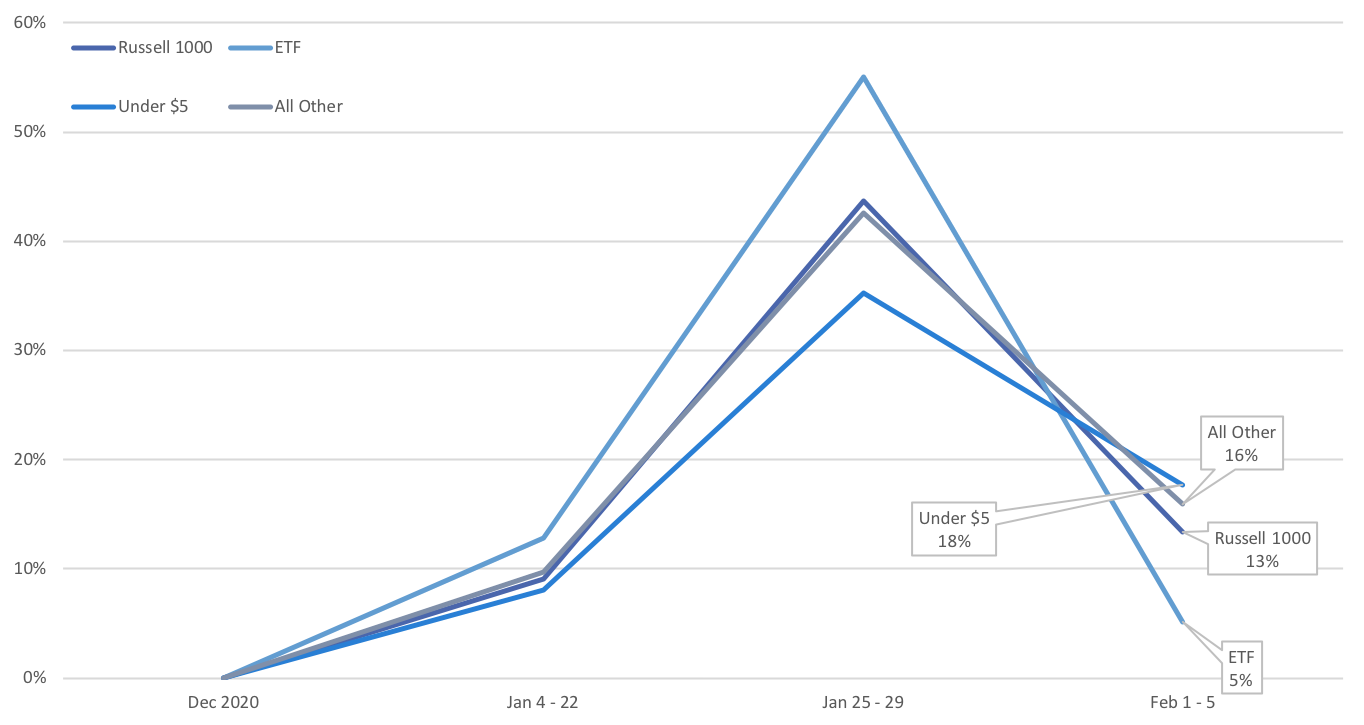
NYSE Quote Volatility Measure: Change vs December
Can the Opening Auction Help?
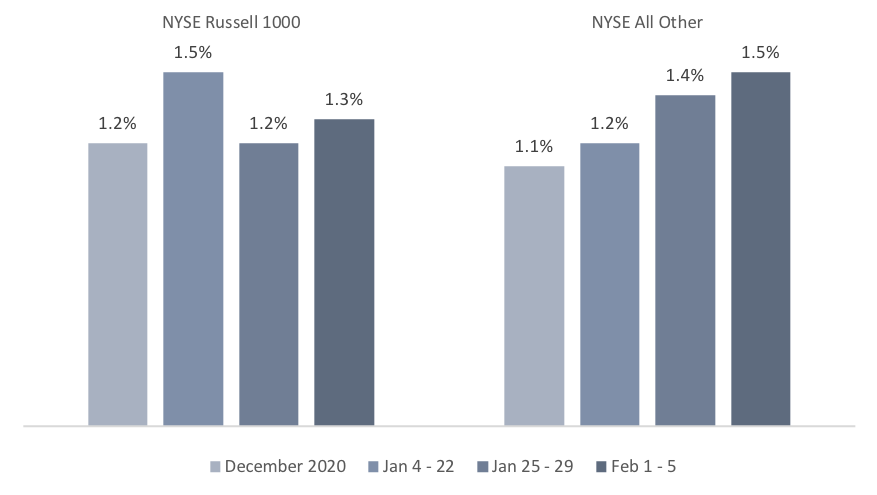
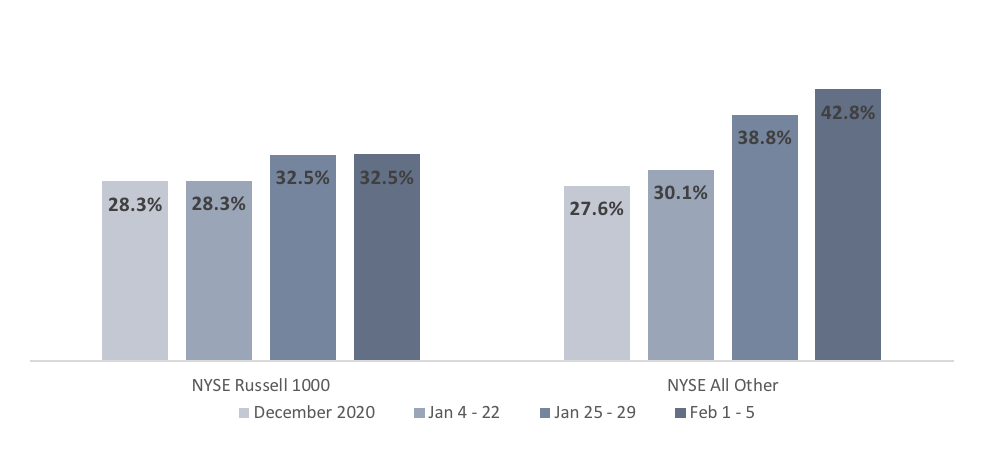
The NYSE Opening Auction has grown with the increase in activity. As expected, growth is concentrated in stocks outside the Russell 1000, however stocks in the Russell 1000 have maintained their Opening Auction liquidity.
Opening Auction Share of Total Market Volume
Examining these auctions further, we see that the source of liquidity in Russell 1000 stocks is less impacted than other stocks, especially when comparing to December 2020. Across all stocks, however, average order size has fallen and the number of very small orders has grown, suggesting increasing participation from retail participants.
We have previously discussed the challenge of finding accessible, on-exchange liquidity in the current high-volume environment. As retail volumes have grown we have seen corresponding volume growth and composition changes in the Opening Auction, making the auction an accessible source for interaction with these flows.
NYSE Market-on-Open Average Order Size
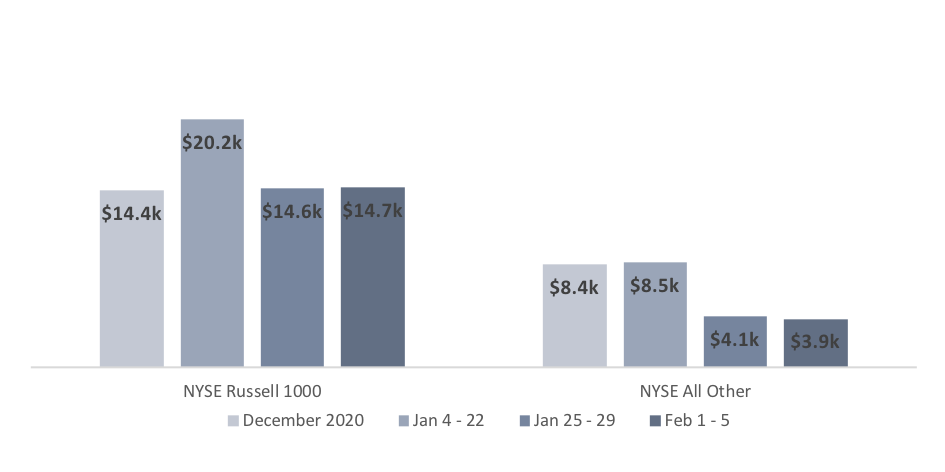
Includes Market DAY orders received prior to the open
NYSE Market-on-Open Orders Less Than 5 Shares
Includes Market DAY orders received prior to the open
1“Russell 1000” includes all stocks in the Russell 1000, regardless of price.