
Data Insights
Q2 2020 Options Review: Record Volumes Continue
July 14, 2020
Q2 2020 continued the trend set by Q1 in being an unprecedented period for the options industry. Between trading floors reopening across the country and trading volume remaining at record highs, it continues to be an extraordinary year. To illustrate: prior to 2020, multi-list volume had never exceeded 40 million contracts in a single day; so far this year, it has surpassed that threshold four times, with eight out of the all-time top 10 multi-list volume days occurring in the first six months.
Top Volume Days
| Rank | Day | Multi-List Equity & ETF Contracts |
| 1 | 6/5/20 | 45,000,097 |
| 2 | 6/11/20 | 44,734,438 |
| 3 | 2/28/20 | 42,842,722 |
| 4 | 2/27/20 | 40,334,447 |
| 5 | 6/12/20 | 39,504,828 |
| 6 | 8/8/11 | 37,972,071 |
| 7 | 2/25/20 | 37,162,324 |
| 8 | 8/5/11 | 35,817,166 |
| 9 | 3/12/20 | 35,005,366 |
| 10 | 2/24/20 | 34,792,486 |
Record Retail Participation
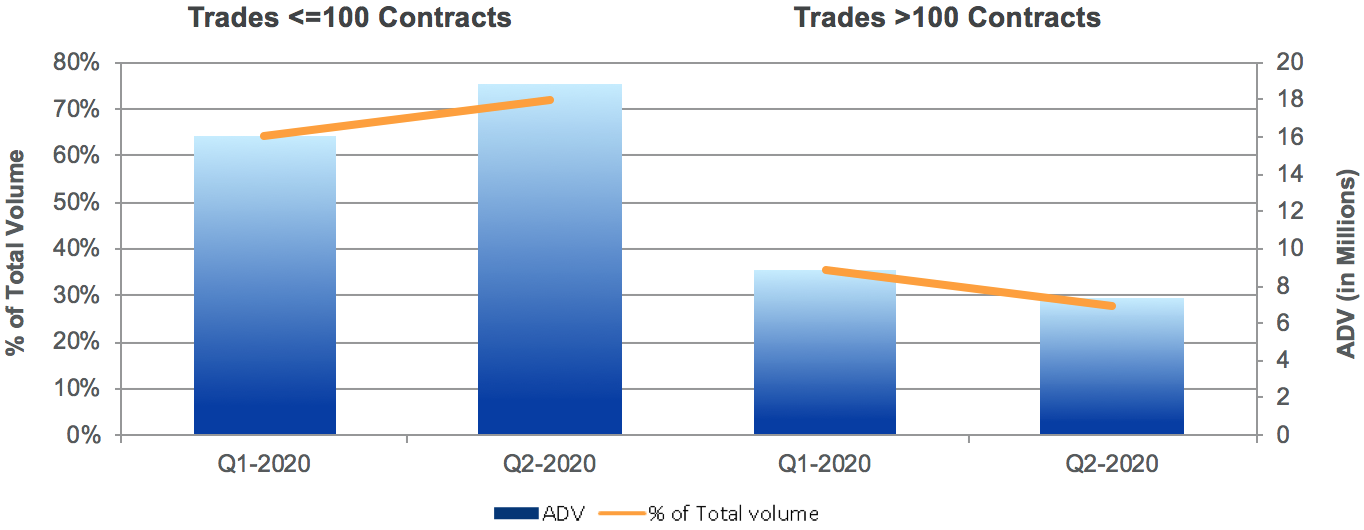
Retail trading has been widely covered, as activity spikes during the work from home era spurred by COVID-19. This is especially true in the options space, where retail participants drove average daily volume (ADV) for multi-list options to reach at least 22 million contracts each month of this year. Despite reduced institutional-sized volume, ADV reached 24.6 million in April, 25.6 million in May and a record 29.6 million contracts in June. Institutional-sized volume — defined here as trades larger than 100 contracts — declined to 27.9% share of options volume in Q2 from 35.6% in Q1.
Industry Volume Distribution by Trade Size
Market Quality
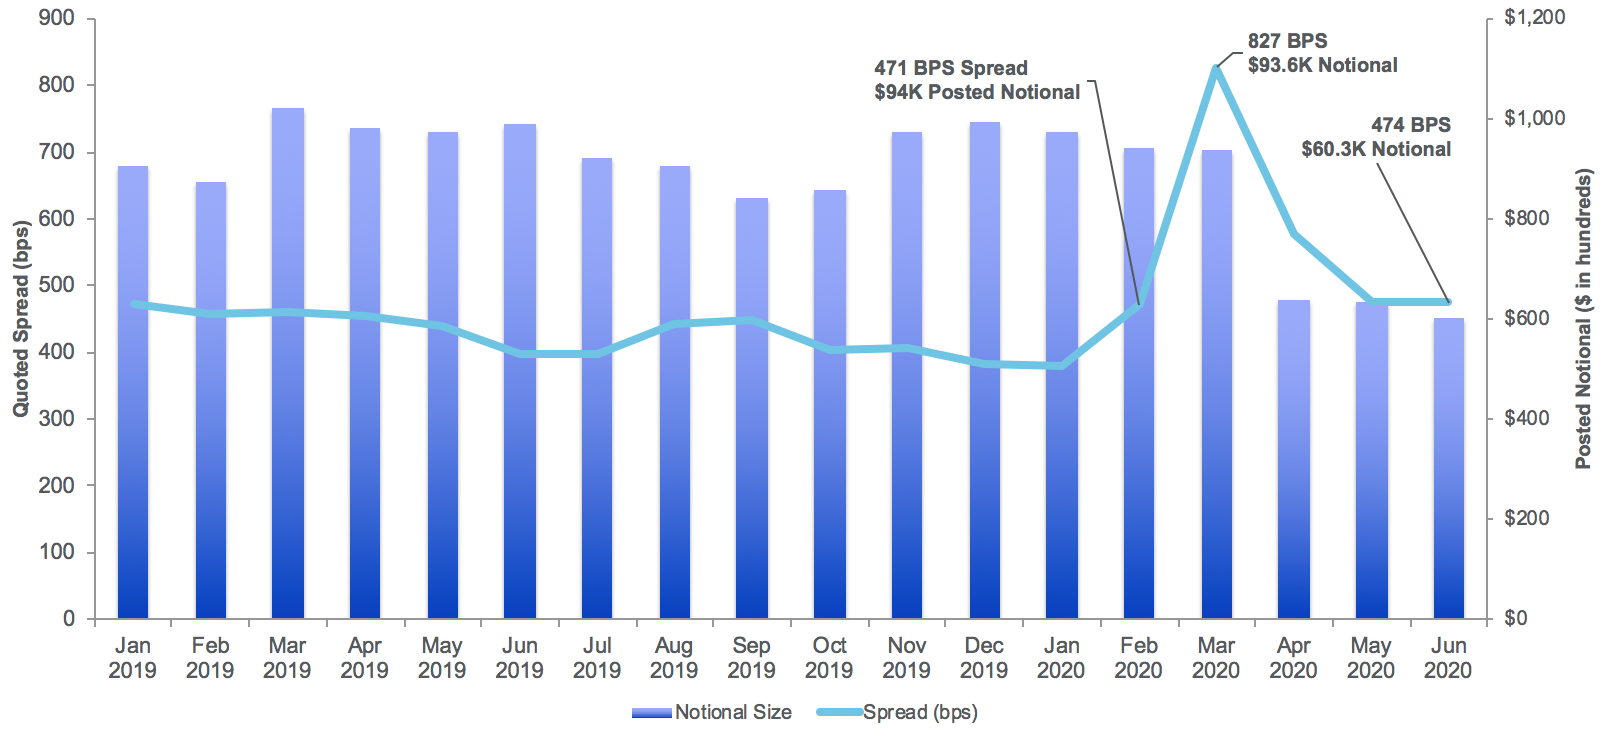
As market volatility due to the pandemic intensified, options quoted spreads measured in basis points widened by 76% in March (to 827 bps from 471 bps in February). The market has since seen spreads tighten back to February levels (474 bps). Market participants have been less eager to post as much liquidity, with posted notional size remaining 36% lower in Q2 than in Q1.
Quoted Spread (bps) and Posted Notional Size
Floors Reopen
Options trading floors, which are important components of liquidity for institutional investors, reopened in the second half of Q2 following temporary closures due to the pandemic. We saw a quick return of open outcry volume following floor re-openings. As expected, its overall share of options volume year-to-date remains lower than pre-closure levels. Prior to March, floor ADV for 2020 was 2.9 million or 9.7% of total options volume. As of the end of Q2, this number is 1.5 million or 5.5% of total volume.
Trade Type Trend
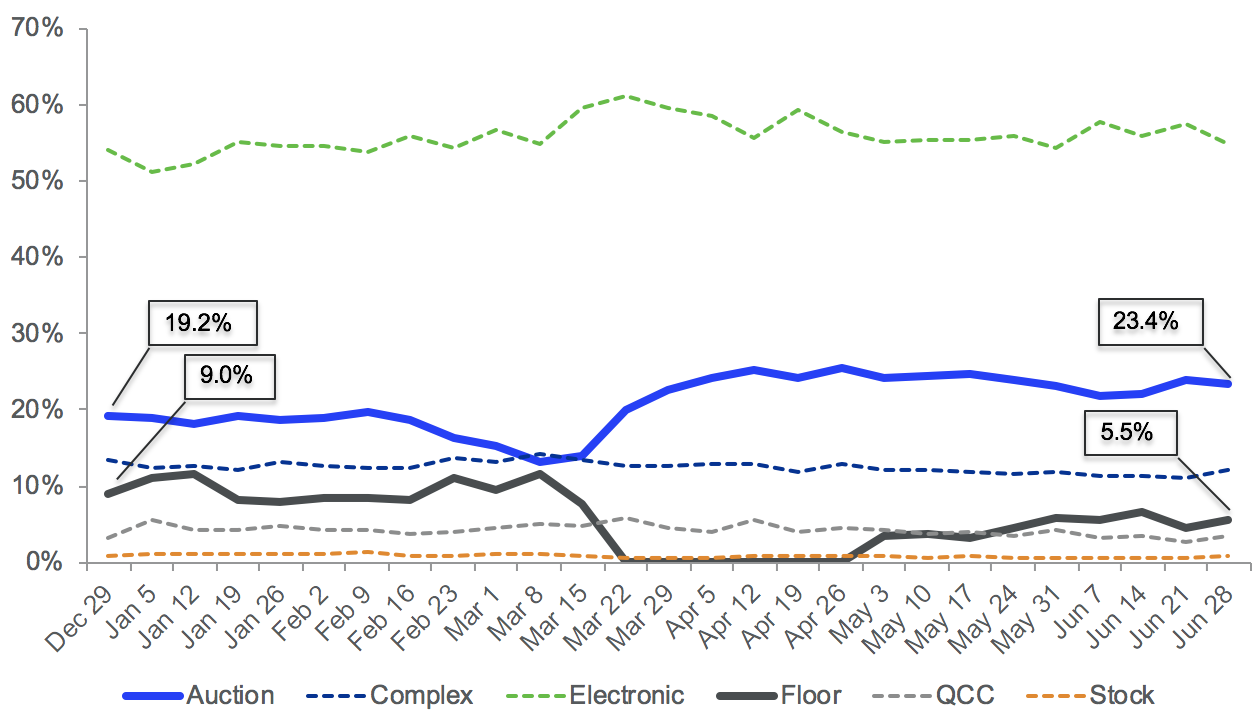
Electronic Auctions Remain Strong
Electronic auction share of options volume grew during the trading floor closure, particularly in large trades above 5,000 contracts, where auctions represented 49.2% of large trade volume. After the floors reopened, auction share of large trades reverted while overall auction share held steady. This shows that auction growth is not strictly correlated to the floors’ closure. Some signs point to continued auction strength coming from growth in retail trading.
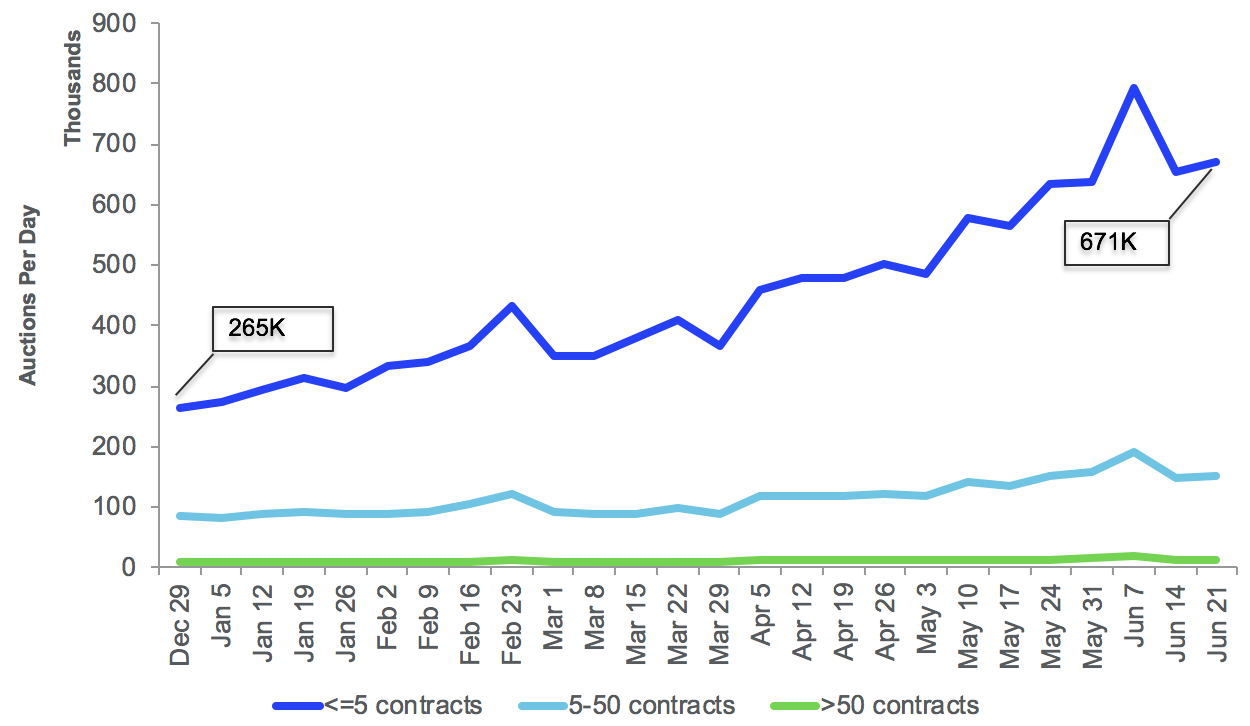
Over the course of this year, the average size of electronic auctions has dropped to just above six contracts per auction from about nine contracts, while the number of auctions per day has grown by about 134%. We can again see the influence of retail here, as this growth is driven by auctions with five or fewer contracts. The number of retail-sized auctions has grown by over 150% since the start of the year, helping offset auction volume that has returned to the floors.
Auction Transactions Per Day By Size Grouping
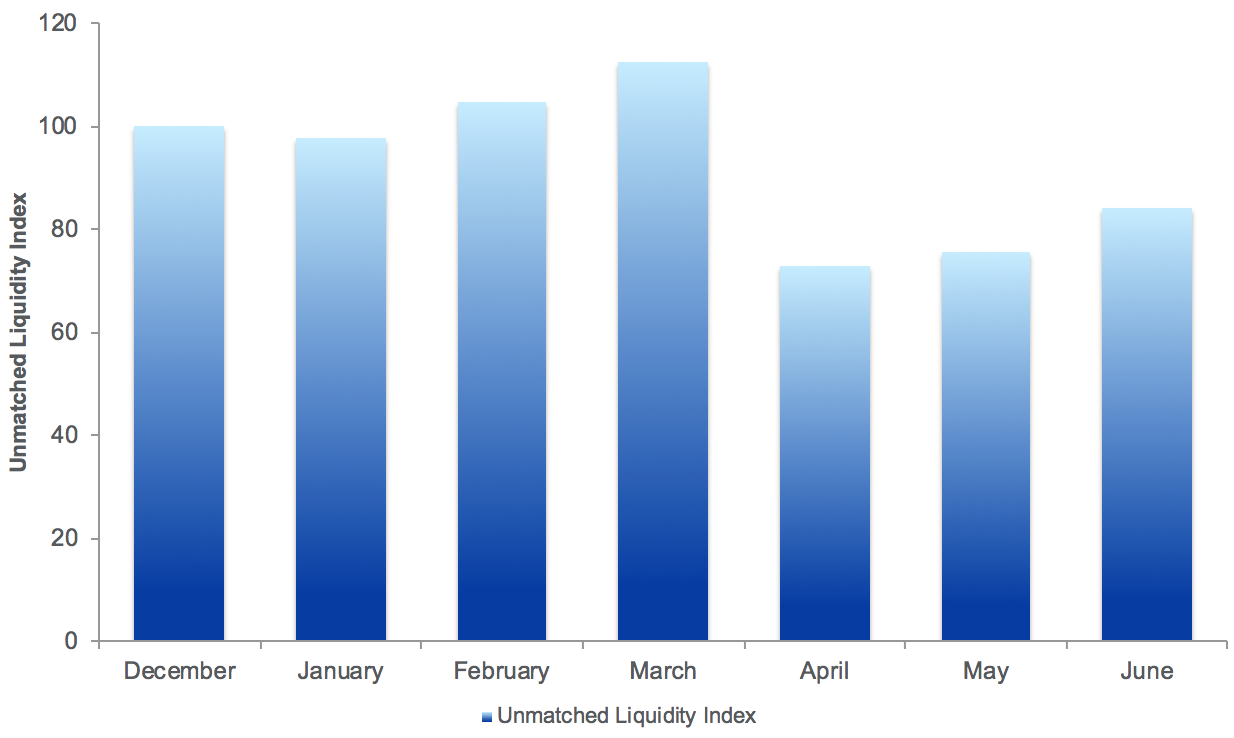
Unmatched Liquidity Index
As volumes continue to reach record highs, it’s important to consider whether this equates to a better liquidity environment, especially for institutional-sized orders. Auctions and QCC trades are paired trades, meaning the initiating interest is matched with contra party interest prior to reaching the market. Interacting with these pre-matched orders depends on a variety of factors, including exchange-specific rules.
To measure the impact of this type of volume increase across the market, we created an “Unmatched Liquidity Index.” This is the ratio of all non-auction and non-QCC volume (“unmatched volume”) to auction and QCC volume (“pre-matched volume”), indexed to December 2019. This index rose as volatility and market volumes increased into March, but then it dropped 35% from March to April when the floors closed. As we know, retail trading heightened and volumes remained at near highs during the closure period, suggesting that record volume totals do not necessarily equate to vastly expanded liquidity across the market. By the end of Q2, the index recovered by 15% to close the quarter at 84.
Unmatched Liquidity Index
Conclusion
In the face of a tumultuous first half of the year across the financial ecosystem, options markets have performed remarkably well. Our systems have handled the record activity smoothly and our Trading Floors have adjusted to socially-distanced open outcry trading. We look forward to what the rest of 2020 has in store.